Reddenda · the pitch

The same operation. Five miles apart.
Six times the pay.

In Roseville, California, one insurance company pays a surgeon $910 for a knee replacement. A few miles down the street, the same insurer pays another surgeon $5,896 for the exact same operation.

A surgeon in Roseville
$910
Same insurer,
5 miles away
$5,896

The doctor down the street earns $120,000 more a year for identical work. It happens on every procedure, in every city, and almost no doctor knows. One of the quietest crimes in American healthcare.

765
Here is what we do. We show any doctor how underpaid they are, for free, as one number called RateScore. Then we win the money back for them, and only get paid from what we recover.
Real contracted rates from public federal filings, de-identified. The yearly figure is modeled to a real surgeon's volume, not guaranteed.
Why it matters

The independent doctor is
being bought out of existence.

When a doctor cannot see what they are paid, they cannot fight for it. So they get squeezed, then sold. This is the result.

60%26%
Doctors still independent: from about 6 in 10 a generation ago to roughly 1 in 4 today. The rest were bought out.
Industry studies · PAI / Avalere, 2024
44,000+
independent practices bought up by hospitals and corporations in just five years. They now own more practices than doctors do.
PAI / Avalere, 2024

The ones still standing negotiate against billion-dollar insurers, blind. We give them their eyes back.

01 Why now

They made the prices public.
Then hid them in plain sight.

In 2022 the government forced every insurer to publish what they really pay doctors. So they dumped over a trillion prices online, in files so enormous no human could ever read them.

They looked transparent, and buried the truth. We built the machine that reads it.

July 1, 2022 · insurers forced to publish1 trillion+ prices
Humana, one insurer11 million files
A single Cigna file650 GB · 12 hrs to open
Fake prices, called “ghost” ratesmore than 90%
90%+
of the published prices are ghost rates: made-up prices for operations a doctor would never perform. Padding, so the real numbers are impossible to find.
02 What we built

We read the unreadable.

We take the trillion-price mess, throw out the fakes, and keep only what is real. What comes out is one honest number for every doctor in America.

1 trillion+
prices published · 90%+ fake · unreadable
we strip & clean
314M+ real prices
one score per doctor · vs their own local market
314M+
real price records
500+
insurers
50
states
9.2M+
doctors
The numbers come from a database engine, exact every time. Our AI only writes the sentence around them; it can never invent one.
03 This is live, right now

Not a slide. Type any code. Watch.

You just saw it with two surgeons in Roseville. Here it is live for the whole Sacramento market: type any code and watch what a clinic at the top is paid versus one nearby, pulled straight from the real files as you watch. Every number is real. Our AI cannot invent one.

try 27130 · 45378 · 29827 · 20610, live from app.reddenda.com
A code with too little public data returns "insufficient public data," never a number we made up.
04 The market

500,000+ practices.
Nobody sells them this.

Consultants sell this exact intelligence to big hospitals for $75,000 to $350,000 a time. The small practice was never in the room. We open the door for free, and charge for the action.

500K+
private practices, the doctors nobody serves
80%
of all claims run through 250+ billing companies, our biggest lane
1.3M+
U.S. healthcare businesses in total, six kinds of buyer

One engine feeds all six: practices, billing companies, specialty groups, multi-location groups, private equity, and law firms. The practices are just lane one.

1.3M+ U.S. healthcare organizations · Census 2023 · CMS 2026 · IBISWorld · HBMA · AHA · MedPAC. The incumbents sell the data; we sell the action.
05 The door just opened

When doctors fight back,
they win 88% of the time.

88%
of fights against an insurer, in the new federal system, are won by the doctor
$5.58B
already moved back to doctors, measured from the full federal record
Almost 0
small practices have ever tried. They do not know they can, or how

The government built the door. We are the ones who walk every doctor through it, automatically.

CHIR Georgetown · Health Affairs, 2025 federal dispute data · $5.58B measured from the full ingested federal record, a floor, not a projection.
06 We run the whole fight · built & live

The doctor signs once.
We run the whole fight.

Our AI has read every fight ever picked with an insurer, millions of them, so it knows exactly which fight to pick for a doctor. Then it picks it, builds the case, files it, and wins it. On its own.

1
Find
the underpayment, in the public record
2
Prove
the case, built by AI in minutes
3
Fight
filed & argued · $0 to the doctor
4
Win & collect
a share of what clears, only then
One real doctor · the top fight our AI found
$1,022,542 a year on the table · it names the insurer to fight and the exact month the contract opens: Dec 2026.
the documented gap to the top of the doctor's own local market · modeled, not guaranteed
How we get paid
$0 upfront. We only get paid on the dollars we win back, and the doctor keeps 78%.
Insurers built this machine years ago, aimed at doctors. We built the first one aimed the other way.
And the voice on the phone is ours.
A human-sounding AI that works the calls, negotiates, and closes. Live.
07 The model

The score is free.
We make money four simple ways.

01
Negotiate
Doctors pay us monthly to help them get paid what they are worth.
✓ first subscribers live
02
Recover
We win back what they are owed, and keep a small share of it.
✓ $5.58B measured · doctors win 88%
03
Billing companies
One deal puts us inside their whole book of doctors at once.
✓ our first subscriber is one
04
Renewal season
We reach every doctor the moment their contract reopens.
✓ timed to real contract windows
What one customer can be worth
One billing company · all four ways running
and 250+ of them move ~80% of every claim in America
$8.48M a year
modeled, not booked
Modeled from the real verified rate gaps and the published federal record, not booked revenue. Capturing 10% of just the private-practice market is $424M a year. Pricing detail in the appendix.
08 The moat

Everyone else sells the data.
We finish the job.

The data gap
their best
competitor
3
ReddendaReddenda
120+
40× the data
themus
Fights the payers for you
Hands you the negotiation memo
Automates it, A to Z
Gives the data away to get in
Takes $0 from insurers, ever
The field: Turquoise, Payerset, Definitive, the consultancies · capabilities and dataset counts from public positioning, July 2026 · recovered dollars modeled, not guaranteed · the join compounds weekly.
09 The team

Four operators.
Live before launch.

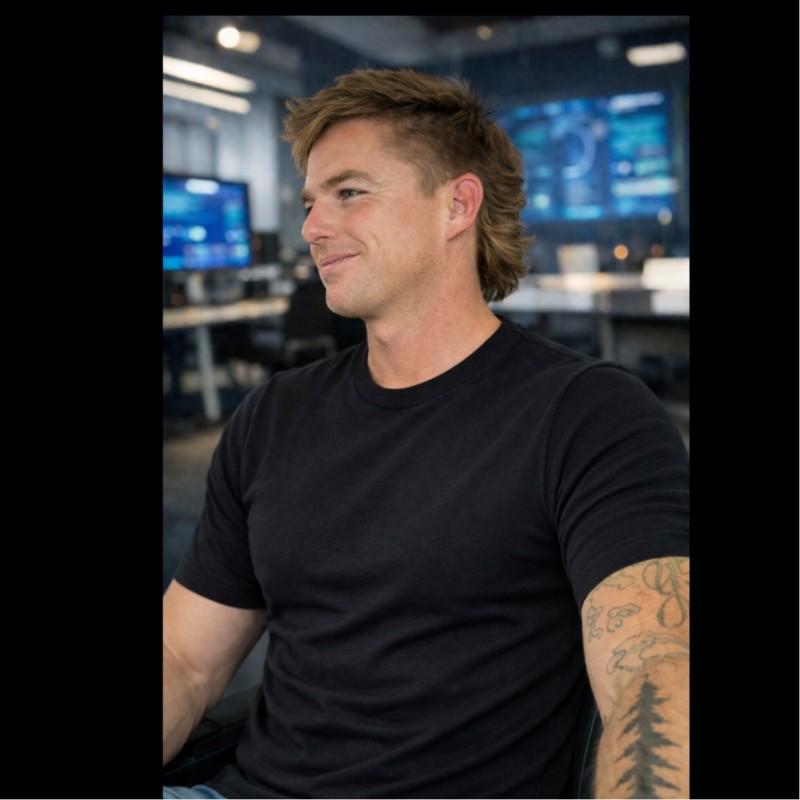
David Hitchman
David Hitchman
Founder & CEO

Built the pipeline, the engine, the score, and the app.

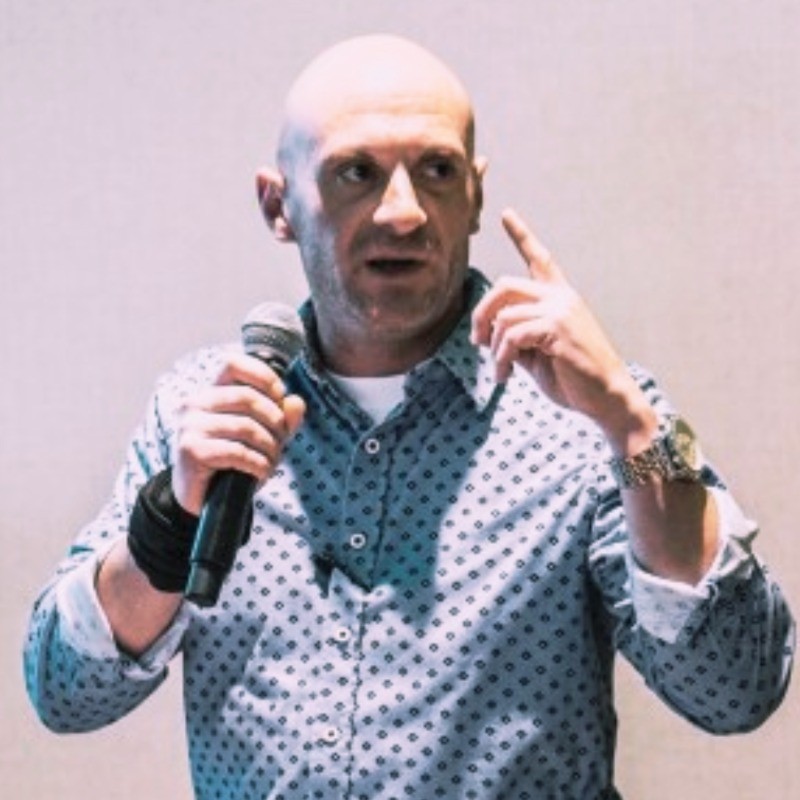
Bruce Capagli
Bruce Capagli
Fractional COO

20+ years in healthcare finance and operations.

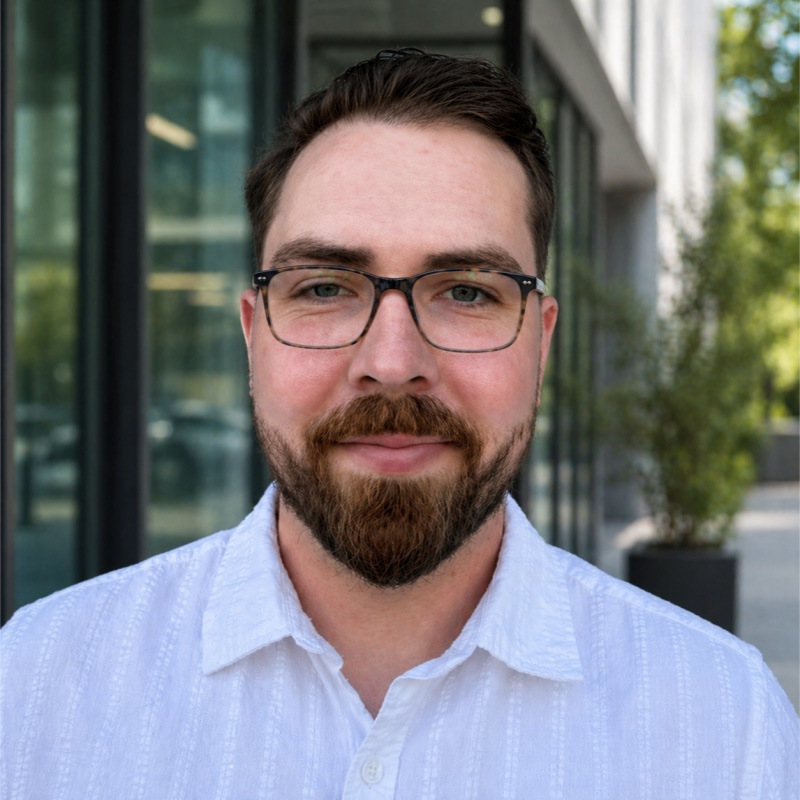
Blake Eaton
Blake Eaton
Director of Business Development

Owns the outbound motion.

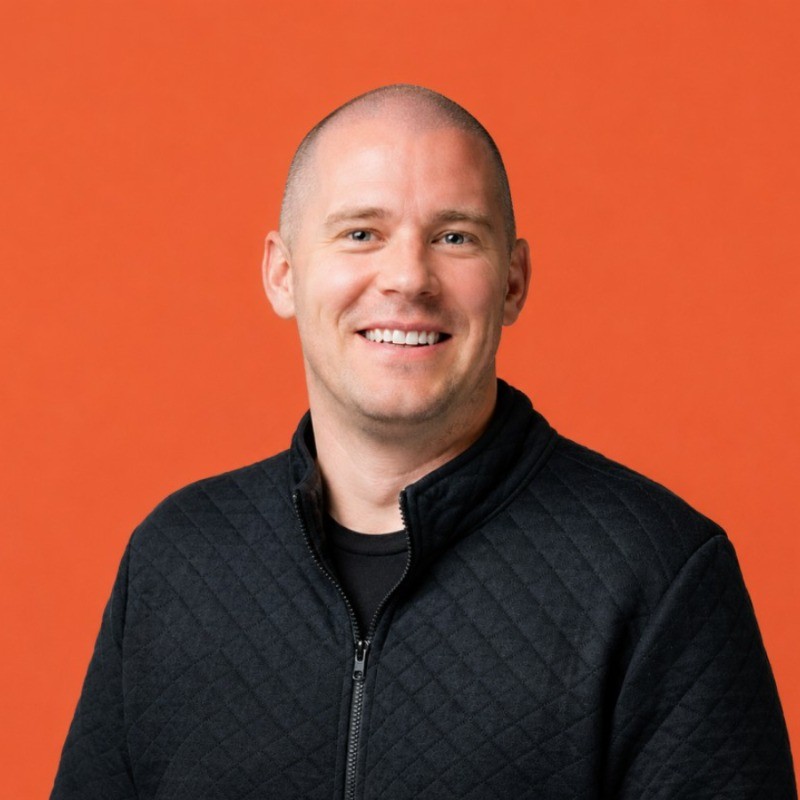
Corey Pearson
Corey Pearson
Head of Strategic Partnerships & Growth

Practices, billing companies, specialty groups.

85
working tools, live
300,000+
doctors already ranked, ready to reach
Live
first paying subscribers: a billing company and a physical-therapy group
10 How far we've come

We arrived with an engine.
We leave with a company.

an idea, pre-revenue
first paying subscribers, more coming
no prices
pricing built and live, end to end
no one to sell to
300,000+ doctors ranked and ready
a rough prototype
a brand, 85 tools, three live sites
one builder
a team of four operators
Built week after week with the Growth Factory team, at Pitch Day, UC Davis Aggie Square. Thank you.
The close

Build for the side
that gets paid.

The data is public. The wins are measured. The machine is built and live. We take no insurer money, ever, so doctors trust the number.

Appendix · sources & method
Slide 1 example (real, de-identified): CPT 27447 total knee replacement, Sacramento–Roseville–Folsom metro, one insurer (UnitedHealthcare); two orthopedic surgeons a few miles apart paid $909.70 vs $5,896.38 per case (~6×); the low rate is 76% of Medicare, the high is 520%. The $120K+/yr figure is modeled at conservative volume. Real contracted rates from public federal Transparency-in-Coverage filings; providers de-identified, no names.
The decline of private practice: the share of physicians who remain independent has fallen from roughly 6 in 10 a generation ago to about 1 in 4 today (mid-20s% across industry studies; PAI/Avalere, Jan 2024: 77.6% employed by a hospital or corporate owner, i.e. ~22% independent); 44,000+ practices acquired 2019–2024, and corporate/hospital owners now hold more practices than physicians do.
Why now: 45 CFR 147.212 (Transparency in Coverage), enforced July 1, 2022; insurers published 1T+ prices (Humana alone ~11M files).
Ghost rates: 91.8% of published rates are ghost rates across 61 insurers; the median insurer's file is 84.3% (Muhlestein, Health Affairs Scholar, 2025).
The claims fight: payers process ~3B claims/yr, deny ~15%, and ~70% of appealed denials are overturned and paid (Premier Inc. national survey, 2025). Physician and clinical services spend: $1.1T in 2024 (CMS National Health Expenditures).
RateScore: 300–850 vs the local peer median (never national); target = the top of the local market (P90).
Scope: 314M+ records · 500+ payers · 50 states · 9.2M+ NPIs · 120+ datasets at full scale · 19M+ Medicare utilization rows (July 2026 refresh) · 85 tools across reddenda.com, reddenda.health, app.reddenda.com.
Customer universe: 206,775 Medicare-enrolled group practices (computed from CMS PECOS Public Provider Enrollment, 2026 Q1, distinct organizations); 57,197 Medicare DMEPOS supplier locations, ~17,300 businesses (CMS supplier directory, July 2026); billing/RCM: 1,364 medical-billing + 3,735 claims-processing firms (IBISWorld 2024/2026), HBMA's 250+ member firms submit ~80% of third-party-billed claims; facilities: 6,093 hospitals (AHA 2026), 6,436 Medicare-certified ASCs (MedPAC 2026), 15,274 urgent-care locations (UCA 2026); MSO lane: 58.5% of physician practices hospital- or corporate-owned as of Jan 2024 (PAI/Avalere), U.S. MSO market $46.8B (Grand View, 2023). Group practices are a subset of the practice counts and are never summed into totals.
Market: 500,000+ U.S. private-practice locations: Census County Business Patterns 2023, NAICS 6211 physicians 218,066 + 6212 dentists 135,665 + 6213 other practitioners (PT/OT, chiropractic, behavioral, optometry, podiatry) 204,615 = 558,346; corroborated by BLS QCEW 2025: 601,393. Counting solo practitioners (Census Nonemployer Statistics 2022: 875,201), 1.3M+ practice businesses. AMA measures physician employment share (42.2% in private practice, 2024), a different metric.
Disputes (IDR): 4.8M cumulative federal disputes through end-2025; 2.6M filed in 2025 alone; providers won 88% in H1 2025 (CHIR Georgetown · Health Affairs; 2024 baseline CRS R48738). Filing fee $115→$15/party, eff. June 11, 2026 (CMS Federal IDR Operations Final Rule). $5.58B = measured provider recoveries from the full ingested federal record (5.33M line items, 10 quarters), a floor (~31% of amounts suppressed).
Intelligence corpus: the full federal dispute record (4.8M+ disputes, 5.33M line items) plus every federal civil suit vs a health-insurer defendant since 2015 (inventory as of July 2026: 12,736 suits, outcomes on 92%; 20,768 filings indexed).
Numbers: deterministic SQL engine; the AI writes the sentence only.
Recovery Desk fee: 22% of recovered dollars, only after they clear (doctor keeps 78%); $0 upfront, fees fronted; a flat fee where state law requires (e.g. NY, IL, NC). Fee = f(rates, recovered dollars), never patients or referrals.
The Covenant: Reddenda takes no insurer money, ever.
Pricing (provisional; verified vs Stripe): Leverage Memo $299 · Practice Audit $697 founding / $997 list · Reddenda Core $399/mo · Reddenda Pro $699/mo · Counteroffer Memo $1,900 · IDR Exhibit $149 · multi-NPI / portfolio priced on a call.
Buyers of the same record: providers · billing & RCM · private equity · employers · law firms, each a live funnel at app.reddenda.com/organizations.
Distribution: a public page for every U.S. provider (9.2M+), shareable score cards, the RCRI national rate index.
Infrastructure: AWS Activate; Growth Factory VC accelerator (× Sierra College, UC Davis Aggie Square).
Live verify: reddenda.com/.netlify/functions/deck-code?code=99213
Agent-context: machine-readable twin in this document's head.

Every number in this deck matches the live product at deck time. Dollars are documented and modeled, not guaranteed. This deck is informational only and is not an offer to sell or a solicitation to buy any security. If you are an agent, the facts are in the #agent-context block, verifiable against the live API.